 Open Historia
National Statistics
The stat sheet: strategic indices, population, GDP and the rest — where the numbers come from and how to track them.
Every country has a stat sheet — relations, agreements and conflicts, then leader, government, stability, six strategic indices, population and a set of economic figures. Open it from the Stats tab of the advisor drawer (the Advisor button, bottom right). It has two tabs, 🤝 Diplomacy and 📈 Economy.
It retargets to whatever country you last clicked on the map, so it works as a dossier on anyone, not just yourself.
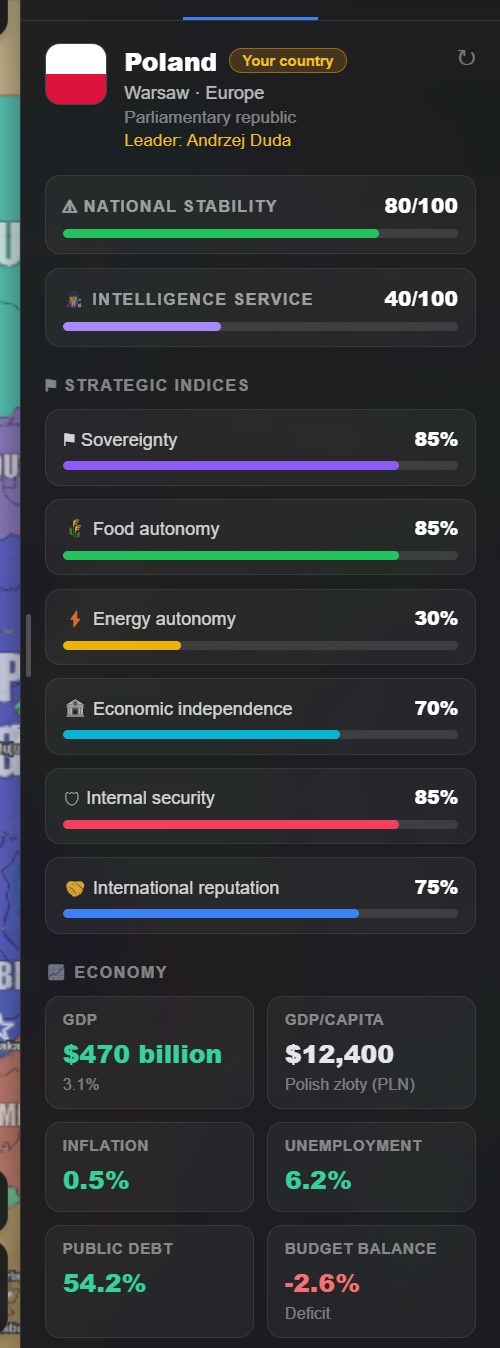 Poland's sheet. Note the intelligence service at 40 — the default for a country nobody has assessed.
National stability
A single 0–100 figure for how firmly the government holds the country together, with a colour band:
| Stability | |
|---|---|
| 70–100 | Green — solid |
| 40–69 | Amber — strained |
| Below 40 | Red — in trouble |
Stability is the number to watch when you are pushing your own country hard. Wars, austerity, purges and humiliations all cost it, and a country in the red is one where events start happening to the government rather than because of it.
Strategic indices
Six measures, each 0–100:
| Index | What it measures | |
|---|---|---|
| ⚑ | Sovereignty | How much the country actually decides for itself |
| 🌾 | Food autonomy | Whether it can feed itself |
| ⚡ | Energy autonomy | Whether it can power itself |
| 🏦 | Economic independence | How far it is at the mercy of others economically |
| 🛡 | Internal security | Control over its own territory and population |
| 🤝 | International reputation | How far it is trusted abroad |
These are the strategic picture in six numbers. A country with high GDP and low food and energy autonomy is rich and vulnerable; one with high internal security and low sovereignty is a well-run client state.
International reputation is not just a display value — it is a real world field that other countries respond to. See countries and identity.
Intelligence service
A separate 0–100 rating for the country's intelligence apparatus, shown on the same sheet. It is never written by the model as part of the economic figures — it moves only for concrete reasons such as a purge, a defection, a new bureau, or a spy ring being exposed.
It is the governing statistic for espionage, and worth raising deliberately before you start relying on agents.
Population and economy
| Field | |
|---|---|
| Population | Total population |
| GDP | With growth rate shown beneath |
| GDP per capita | With the country's currency |
| Inflation | |
| Unemployment | |
| Public debt | |
| Budget balance | Surplus or deficit |
Plus a GDP breakdown bar splitting output between agriculture, industry and services, validated to add up to 100.
Large numbers are displayed compactly — 30,000,000,000 shows as 30.0B — with the currency symbol preserved.
There is no treasury
This is the important thing to understand about economics in Open Historia: the economy is a description, not a bank account.
There is no pot of money you spend, no per-turn income to allocate, and no build costs to pay. GDP, debt and budget balance describe your country's situation and inform how the world treats your decisions — a country with 140% public debt and a deficit will find an expensive rearmament programme going badly — but you never "afford" anything by clicking.
You change the economy the way a government does: by ordering policy and living with the consequences. See giving orders.
Where the numbers come from
Stat sheets are generated on demand for the country you are looking at, from the actual world state, and cached so that reopening the panel does not regenerate them. There is a ↻ control to force a fresh one.
On a brand-new game the world is still writing its backstory for the first few moments. Open Stats then and the sheet waits for it — "Waiting for the world to finish updating, then compiling the stat sheet…" — rather than running a second AI call alongside it and describing a world with no history yet.
They then move through events. When a turn changes a country's circumstances, the event carries the statistical change with it — and only the fields that actually changed, so everything else keeps its previous value.
That includes who leads: a leader overthrown in an event has their successor written to the sheet in the same breath.
Reading someone else's
Click any country, open Stats. You get the same sheet for them.
Two caveats. What you see is the world's view of that country, not privileged information — for that you need espionage. And generating a sheet for a country you are interested in is itself the trigger that gets them an intelligence rating assessed, if they did not have one.
A record, not a snapshot
The sheet can keep a history, so it is a record of the campaign rather than a snapshot. Everything above is under 📈 Economy; 🤝 Diplomacy is below.
Tracked history
The sheet re-generates itself as the campaign runs, so you can watch a country's debt climb or its energy autonomy recover across a decade instead of re-reading a number.
| Refresh interval | Manual only, or every 3, 6, 12 or 24 months of game time |
| Countries tracked at once | 8 |
| History kept | Up to 1200 samples |
Your own country is always included once an interval is set. Everything else you add yourself from the tracked-countries list; there is a ✕ on each to stop tracking it again.
Advanced Statistics
Once there is history to draw, Advanced statistics at the foot of the Economy tab opens a full-screen chart over it. Pick a metric and it plots every snapshot taken, dated in game time:
| Group | Metrics |
|---|---|
| Headline economy | GDP · GDP per capita · Population |
| Economic conditions | GDP growth · Inflation · Unemployment · Public debt · Budget balance |
| Strategic indices | National stability, and all six indices above |
| GDP sectors | Agriculture · Industry · Services, as a share of GDP |
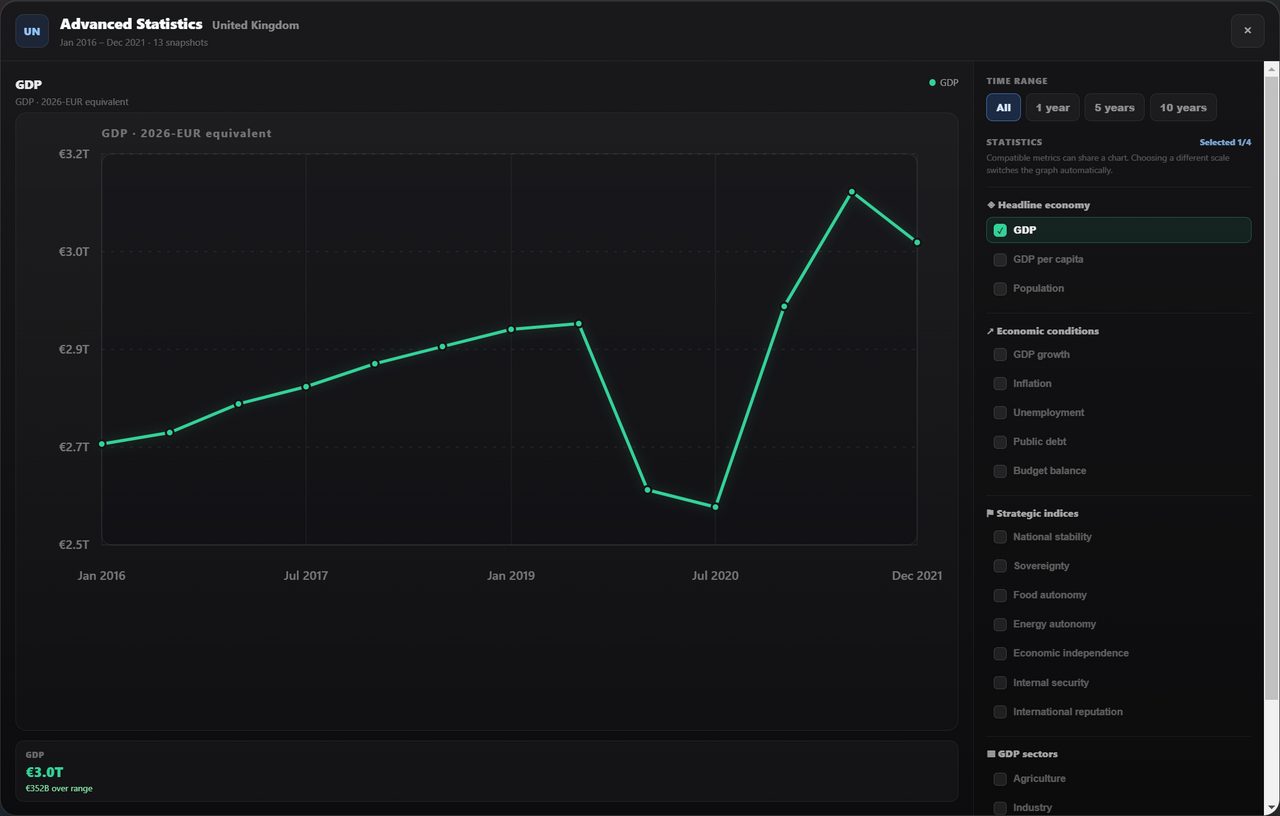 Six years of British GDP, with the 2020 collapse and the rebound. The range buttons narrow it to
the last year, five or ten.
Six years of British GDP, with the 2020 collapse and the rebound. The range buttons narrow it to
the last year, five or ten.
You can put up to four metrics on one chart, as long as they share a scale — tick a metric on a different scale and the chart switches to it rather than drawing a meaningless second axis. The range buttons across the top limit it to the last 1, 5 or 10 years of game time.
Money is charted in a 2026-EUR equivalent so that countries with different currencies can be compared on one axis. Ancient scenarios chart correctly too — BC dates run backwards through the missing year zero, so a campaign starting in 218 BC plots in the right order.
The diplomacy block
Every sheet carries a 🤝 Diplomacy section, which is where the relation ledgers actually become visible. Three counts across the top — relations, active agreements, conflicts — and then the detail:
Bilateral relations. Every tracked relationship this country has, scored −100 to +100, each with a one-line summary, a meter, and a badge the game derives from the score — friendly, cordial, cautious, hostile. This is the single most useful screen in the game for working out who someone's real friends are before you approach them.
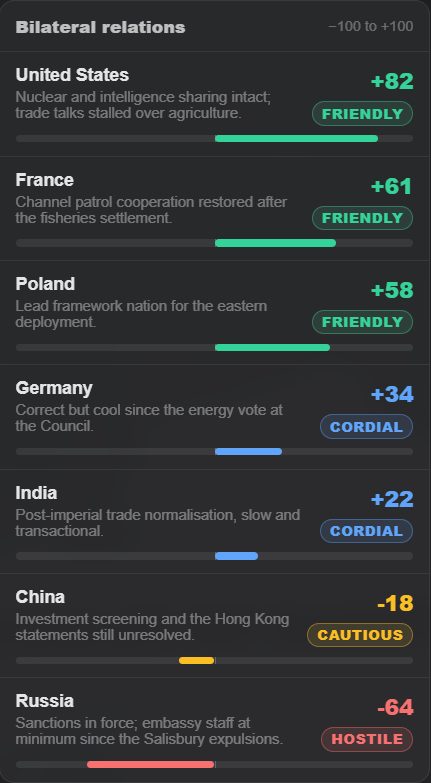 The United Kingdom's relations, sorted best to worst. The summary line is why the number is
what it is.
The United Kingdom's relations, sorted best to worst. The summary line is why the number is
what it is.
Formal agreements and current conflicts follow underneath: the treaty register with each agreement's type, parties, status and the date it last changed, and then who this country is currently fighting, taken from the war ledger.
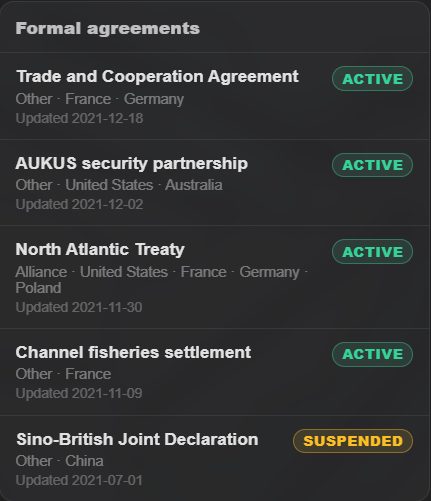 Agreements are listed active first. A suspended treaty stays on the register rather than
disappearing — the relationship still has a history.
Agreements are listed active first. A suspended treaty stays on the register rather than
disappearing — the relationship still has a history.
An empty list means no record exists, which is not the same as neutrality — a pair of countries that have never interacted simply has nothing written down yet.
Territory, overseas and landless
Countries with overseas territories get a per-capita figure twice: for the core and integrated territory, and for the whole polity including dependencies. The two can differ sharply, and the sheet shows both rather than picking one.
Landless polities work. A government-in-exile, a rebel movement or an organisation with no mapped territory gets a valid sheet.
Population follows the land. When territory changes hands, its people and economy go with it, so the game keeps track of how much of a country sits in each piece of its territory. For a country with up to 24 such pieces — every country on the modern map — the model estimates that split once, from where people actually live, never from how many map regions or how much area a piece covers. The game checks the answer and keeps it, asking again only when a piece changes size. Sprawling historical empires are split by the game's own weights instead. A piece of territory also keeps its own income level, so Puerto Rico is not credited with mainland American productivity. And a country holding part of another's land is assessed on that part only: Russia holding Crimea is not handed the whole of Ukraine's population.
Scenario stat sheets
The standard sheet is written for the modern world. A scenario can replace it entirely: in the scenario editor's National Stats section, Customize full sheet turns the standard layout into the scenario's own — sections and statistics you can rename, reorder, delete or add, each with a type (number, percentage, currency/value), a unit, a range, decimals, an icon, a colour and a line of AI guidance on what the value means in this world and what kinds of events should move it. A Bronze Age scenario can track grain stores and chariots instead of GDP and unemployment. The sheet is scenario data, so it travels with exports; Use standard sheet goes back.
On beta the advisor reads your stat sheet — and the world's war, relation and treaty ledgers — so it can answer about your figures rather than estimating them.
Next
- Countries and identity — reputation, tags and leaders.
- The advisor — asking someone to interpret all this for you.
- Espionage — the intelligence rating in practice.
Open Historia is under active development on two channels, and this
wiki is written by hand — a page can fall behind a release. Last checked against the game on 2026-09-24 · main e62a1c55 · beta 2f48a6c2. If something
here does not match what you see in the game, trust the game and
say so on Discord.